You first have to tell Gnuplot to use a style that uses points, e.g. with points or with linespoints. Try for example:
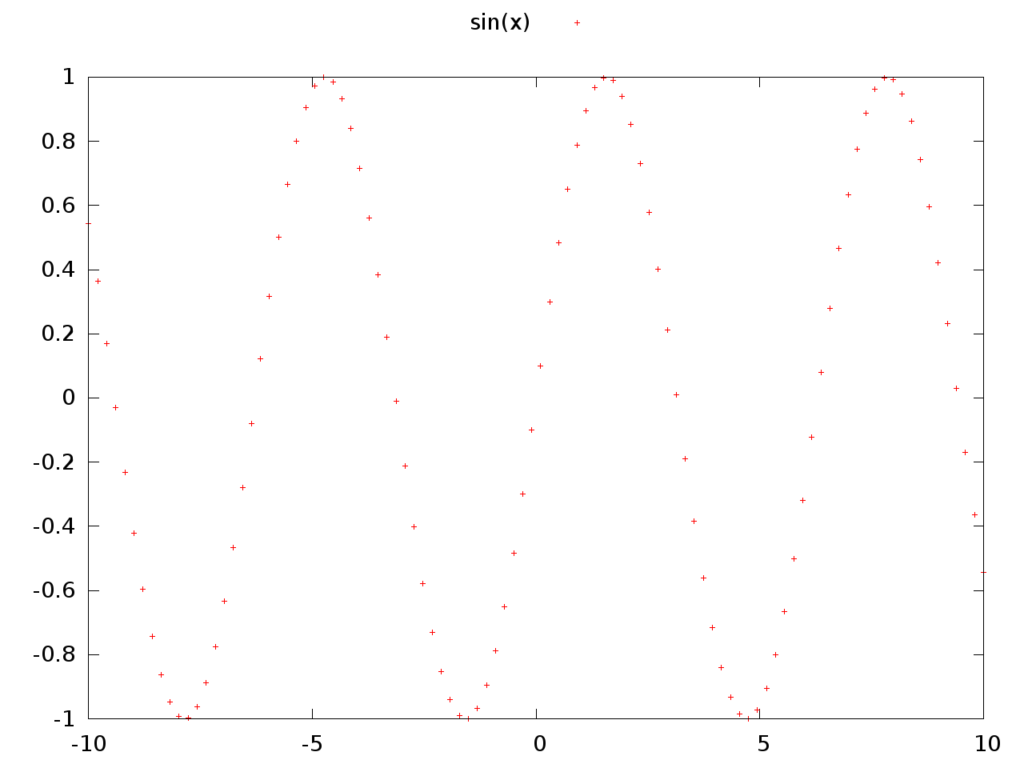
plot sin(x) with points
Output:
Now try:
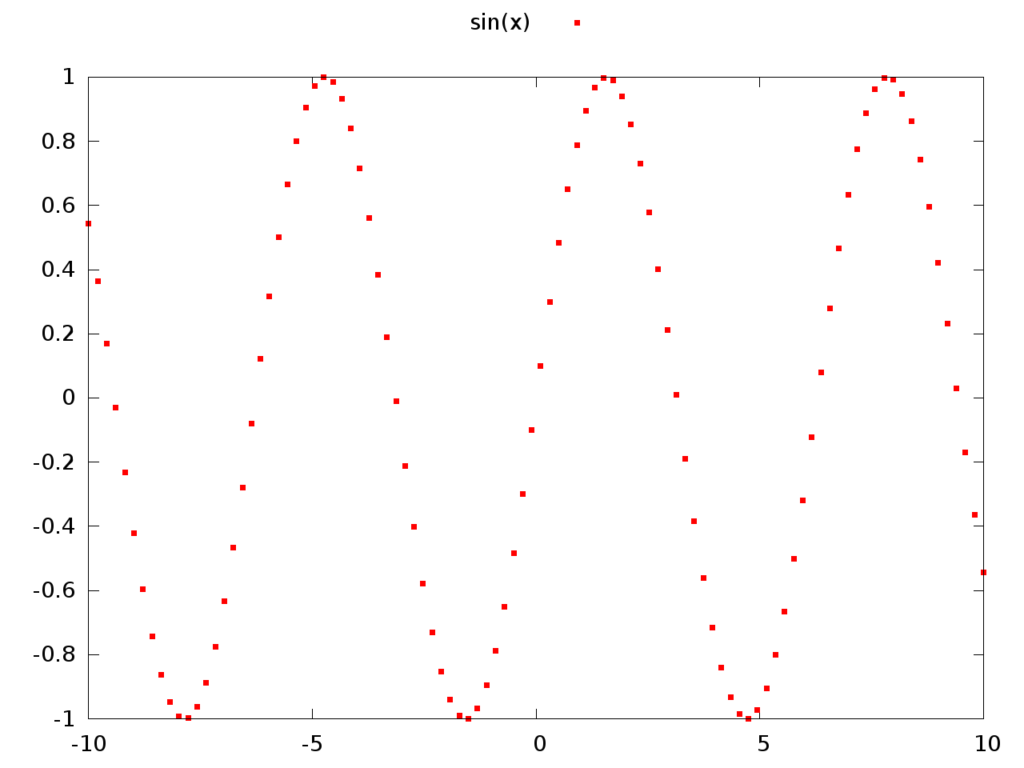
plot sin(x) with points pointtype 5
Output:
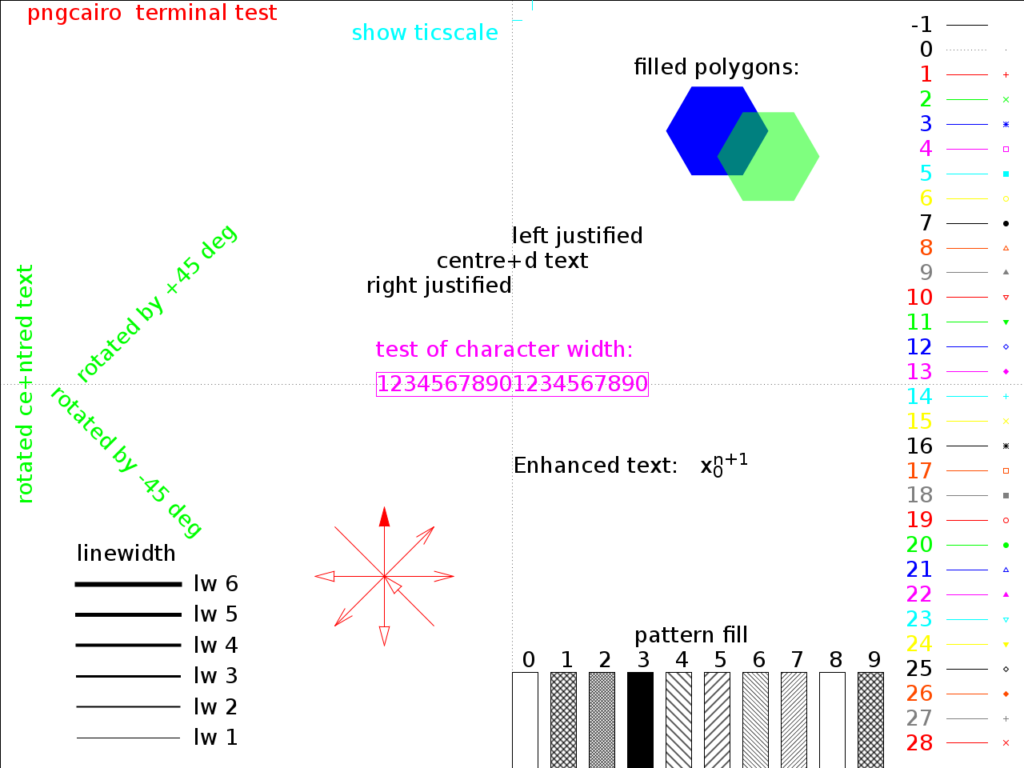
You may also want to look at the output from the test command which shows you the capabilities of the current terminal. Here are the capabilities for my pngairo terminal: