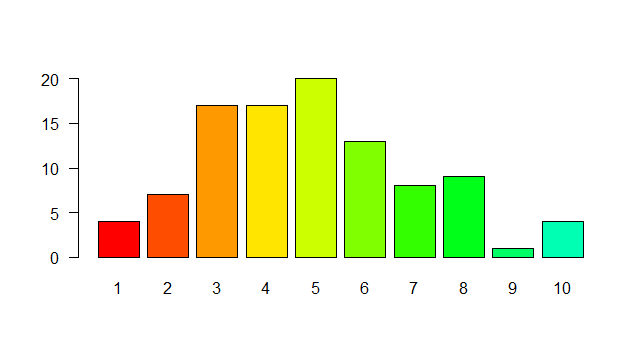
Not sure if this is what you mean, but try setting las=1. Here’s an example:
require(grDevices)
tN <- table(Ni <- stats::rpois(100, lambda=5))
r <- barplot(tN, col=rainbow(20), las=1)

That represents the style of axis labels. (0=parallel, 1=all horizontal, 2=all perpendicular to axis, 3=all vertical)
