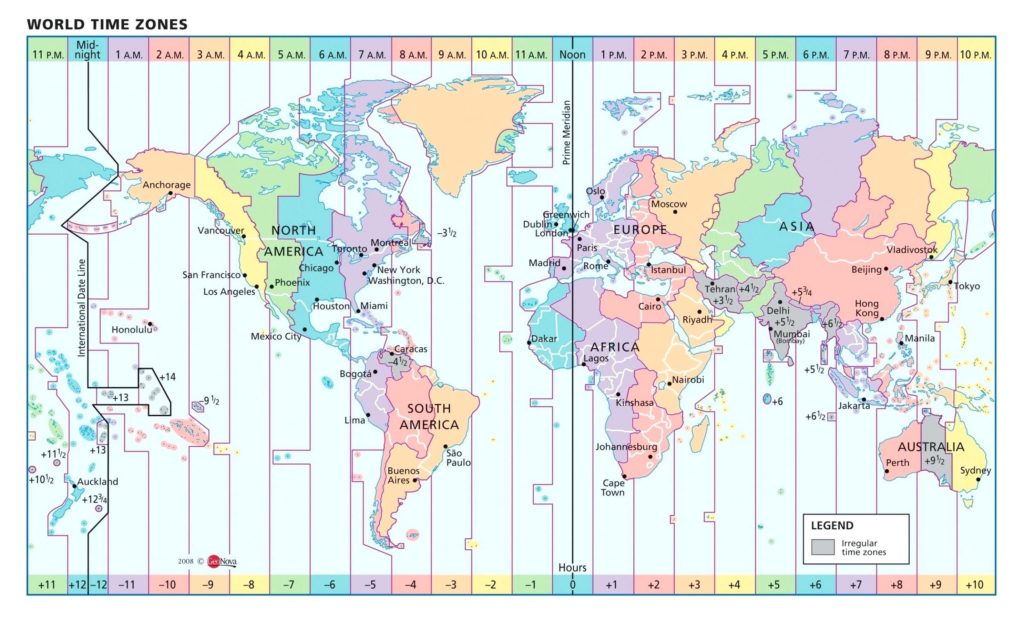
Is it possible to draw lines indicating time zones and show GMT offset labels on a MapChart?
We are using am4geodata_worldHigh and the Mercator projection (am4maps.projections.Mercator())
Conceptually, we want to produce something like this image (doesn’t need to be quite as fancy):