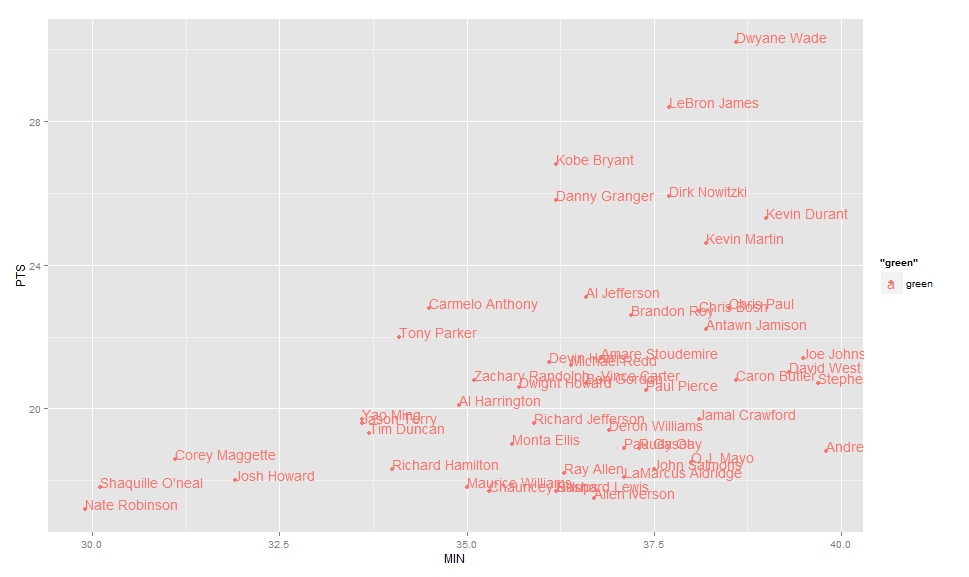
Use geom_text , with aes label. You can play with hjust, vjust to adjust text position.
ggplot(nba, aes(x= MIN, y= PTS, colour="green", label=Name))+
  geom_point() +geom_text(hjust=0, vjust=0)
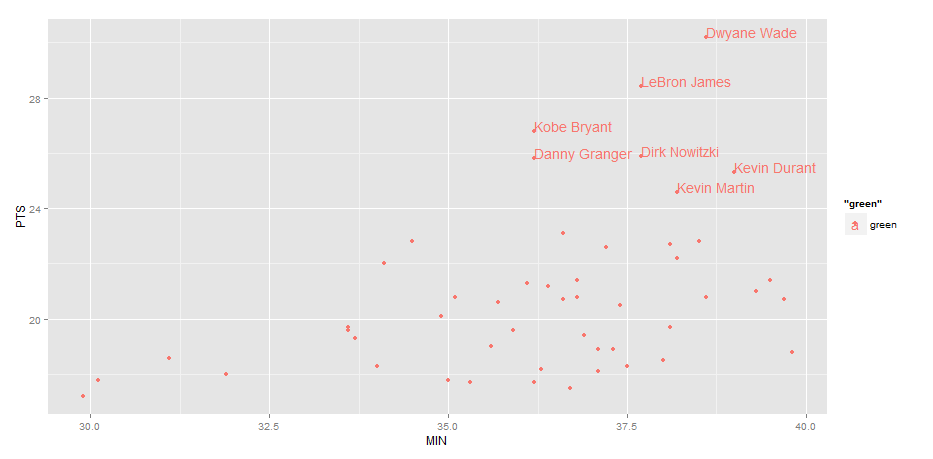
EDIT: Label only values above a certain threshold:
  ggplot(nba, aes(x= MIN, y= PTS, colour="green", label=Name))+
  geom_point() +

Use geom_text , with aes label. You can play with hjust, vjust to adjust text position.

ggplot(nba, aes(x= MIN, y= PTS, colour="green", label=Name))+
  geom_point() +geom_text(hjust=0, vjust=0)

enter image description here
EDIT: Label only values above a certain threshold:

  ggplot(nba, aes(x= MIN, y= PTS, colour="green", label=Name))+
  geom_point() +
  geom_text(aes(label=ifelse(PTS>24,as.character(Name),'')),hjust=0,vjust=0)

chart with conditional labels

  geom_text(aes(label=ifelse(PTS>24,as.character(Name),'')),hjust=0,vjust=0)