The problem is most likely the way you have your months stored. By the looks of things I would hazard to guess they are actually text and not numbers formatted to display the name of the month in full. In order to get the months to display in your graph, you will either need to enter the months as a serial date which Excel can understand as a number, or create a dummy column to hold this same information which you can latter hide.
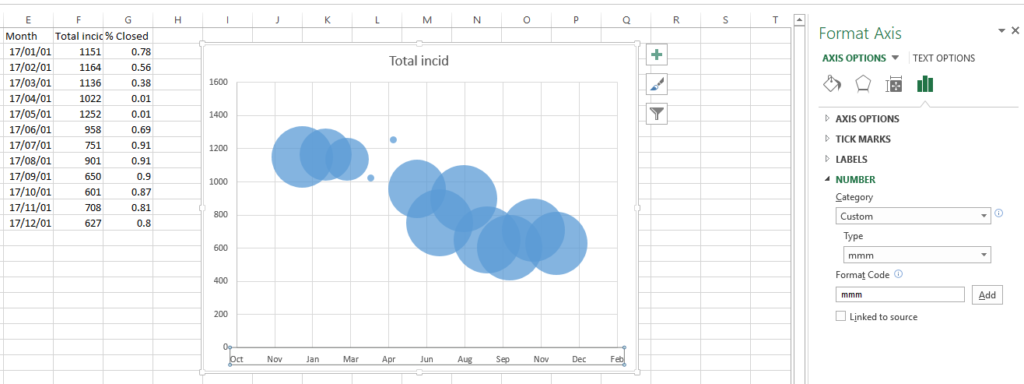
once you have your months in a serial date that excel can handle, you can then select the X-axis and set the format style. Select custom as the category, and then use mmm or mmmm as you custom format to display just the name of the month. Alternatively you could show the whole date using date formats.
Two ways to enter a date serial are to simply enter the numeric date format that matches your regional settings or use the following formula:
=DATE(year,month,day)
Where year, month and day are all integer, or formulas that evaluate to acceptable integers