The data:
dat <- read.table(text = "group   x   y
group1  0   5
group4  0   5
group1  7   5
group4  0   5
group5  7   5
group1  7   5
group1  0   6
group2  0   6
group4  0   5
group2  0   5
group3  7   5", header = TRUE)
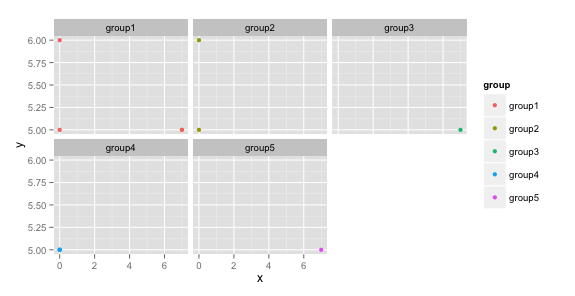
You can use the excellent ggplot2 package for easy plotting:
library(ggplot2)
ggplot(dat, aes(x = x, y = y, colour = group)) +
  geom_point() +
  facet_wrap( ~ group)
Here, I used facet_wrap to create facets for each group. In principle this is not necessary, since the groups’ points can be distinguished by their colour. But in this case there are only three different locations at the figure. Hence, not all points would be visible if the data were plotted in a single scatterplot.