EDIT: I’ve essentially answered the OP.
I just spent a while learning how text and images work in R, still don’t understand them all too well, but here’s a start to solving your issue.
These posts helped me greatly:
display a matrix, including the values, as a heatmap
Here’s a couple of posts that can probably answer your question thoroughly
How to show matrix values on Levelplot
You might be able to draw ideas from the code below, but I stress that you look at the thread above this sentence.
EDIT: code below is probably what you want!
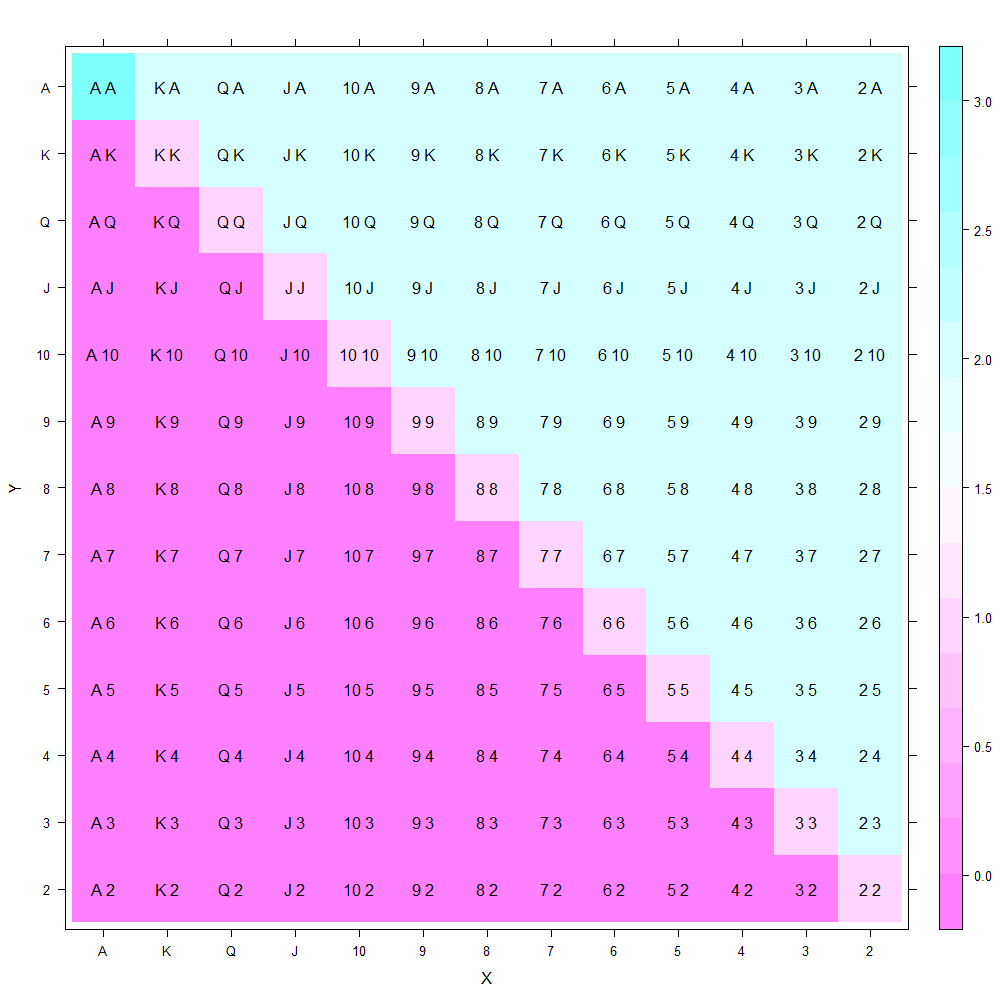
library(lattice)
library(latticeExtra)

x <- c("A", "K", "Q", "J", "10", "9", "8", "7", "6", "5", "4", "3", "2")
y <- c("2", "3", "4", "5", "6", "7", "8", "9", "10", "J", "Q", "K", "A" )

grid <- expand.grid(X= x, Y= y)

grid$Z <- c(
  rep(0, 12), rep(1, 1),
  rep(0, 11), rep(1, 1), rep(2, 1),
  rep(0, 10), rep(1, 1), rep(2, 2),
  rep(0, 9), rep(1, 1), rep(2, 3),
  rep(0, 8), rep(1, 1), rep(2, 4),
  rep(0, 7), rep(1, 1), rep(2, 5),
  rep(0, 6), rep(1, 1), rep(2, 6),
  rep(0, 5), rep(1, 1), rep(2, 7),
  rep(0, 4), rep(1, 1), rep(2, 8),
  rep(0, 3), rep(1, 1), rep(2, 9),
  rep(0, 2), rep(1, 1), rep(2, 10),
  rep(0, 1), rep(1, 1), rep(2, 11),
  rep(3,1), rep(2, 12)
)

levelplot(Z ~ X*Y, data = grid) +
layer(panel.text(X, Y, paste(X, Y)), data = grid)
I will leave it to you to figure out how to choose different colors, and insert the varying text with the “s” and “o” attached.
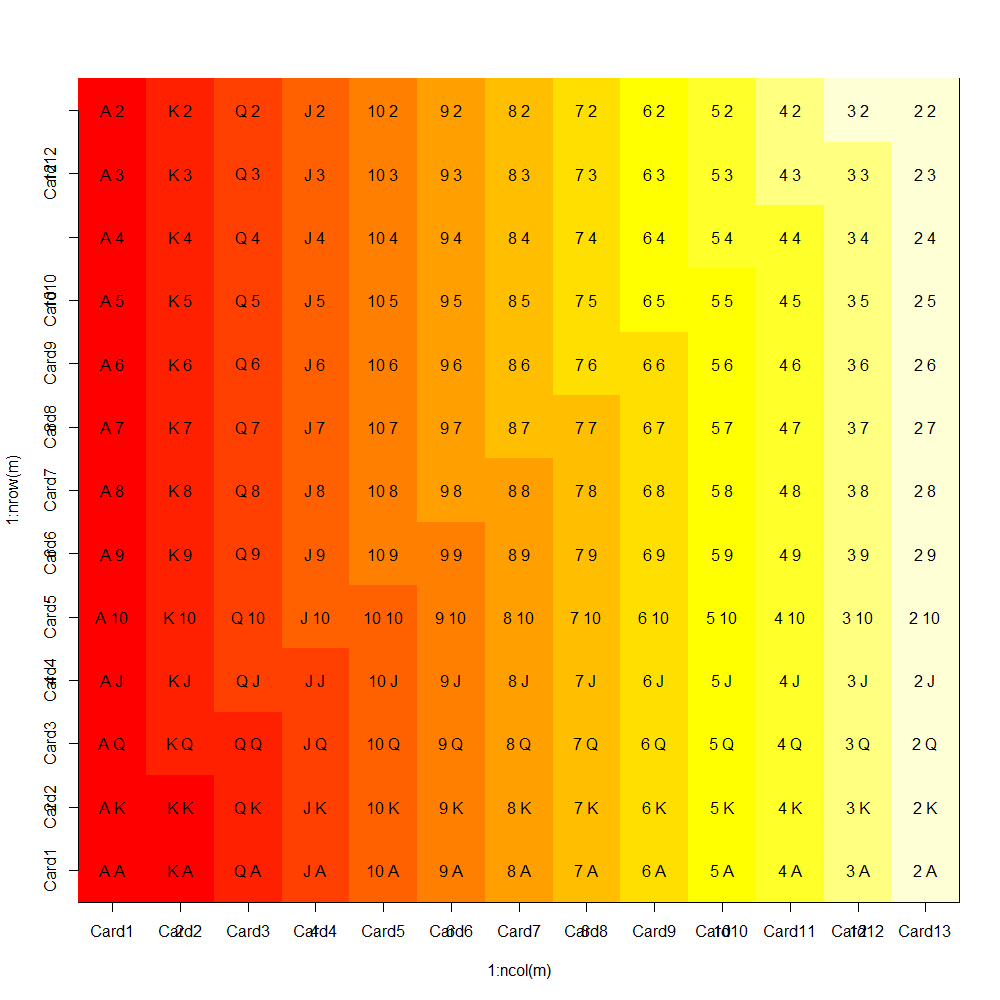
m <- matrix(1:169, ncol=13)
colnames(m) <- paste("Card", 1:13, sep="")
rownames(m) <- paste("Card", 1:13, sep="")

image(1:ncol(m), 1:nrow(m), t(m))
axis(1, 1:ncol(m), colnames(m))
axis(2, 1:nrow(m), rownames(m))

x <- as.data.frame(c("A", "K", "Q", "J", "10", "9", "8", "7", "6", "5", "4", "3", "2"))
y <- as.data.frame(c("A", "K", "Q", "J", "10", "9", "8", "7", "6", "5", "4", "3", "2"))
z <- seq(1, 13, 1)

for (i in 1:13)
  for (j in 1:13){
text(z[i], z[j], paste(x[i,], y[j,]))
    }