The tutorial @Henrik mentioned is an excellent resource for learning how to create plots with the ggplot2 package.
An example with your data:
# transforming the data from wide to long
library(reshape2)
dfm <- melt(df, id = "TY")
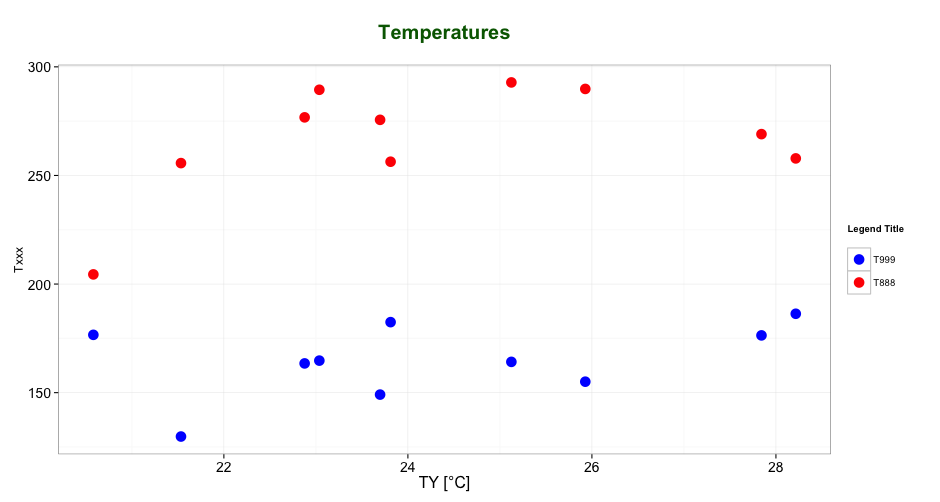
# creating a scatterplot
ggplot(data = dfm, aes(x = TY, y = value, color = variable)) +
geom_point(size=5) +
labs(title = "Temperatures\n", x = "TY [°C]", y = "Txxx", color = "Legend Title\n") +
scale_color_manual(labels = c("T999", "T888"), values = c("blue", "red")) +
theme_bw() +
theme(axis.text.x = element_text(size = 14), axis.title.x = element_text(size = 16),
axis.text.y = element_text(size = 14), axis.title.y = element_text(size = 16),
plot.title = element_text(size = 20, face = "bold", color = "darkgreen"))
this results in:
As mentioned by @user2739472 in the comments: If you only want to change the legend text labels and not the colours from ggplot’s default palette, you can use scale_color_hue(labels = c("T999", "T888")) instead of scale_color_manual().