Change the generation of the data metric to repeat element-wise and it should be correct:
'metric': [item for item in list(nba.columns) for i in range(len(nba.index))],
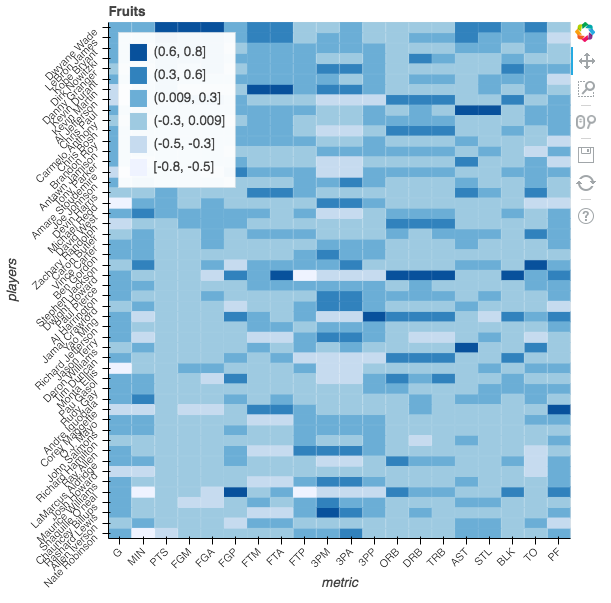
So the code that works for me is the following:
from bokeh.charts import HeatMap, show, output_file
import pandas as pd, numpy as np
from urllib2 import urlopen

nba = pd.read_csv(urlopen("http://datasets.flowingdata.com/ppg2008.csv"), index_col=0)

# Normalize the data columns and sort.
nba = (nba - nba.mean()) / (nba.max() - nba.min())
nba.sort_values(by = 'PTS', inplace=True)

score = []
for x in nba.apply(tuple):
  score.extend(x)

data = {
  'players': list(nba.index) * len(nba.columns),
  'metric':  [item for item in list(nba.columns) for i in range(len(nba.index))],
  'score':   score,
}

output_file('test.html')
hm = HeatMap(data, x='metric', y='players',values='score', title='Fruits', stat=None)
show(hm)