Here’s a solution using base R graphics:
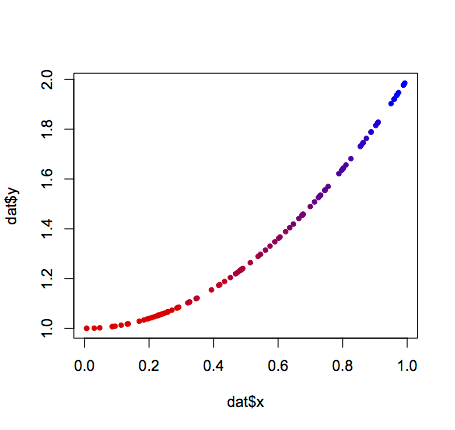
#Some sample data
x <- runif(100)
dat <- data.frame(x = x,y = x^2 + 1)

#Create a function to generate a continuous color palette
rbPal <- colorRampPalette(c('red','blue'))

#This adds a column of color values
# based on the y values
dat$Col <- rbPal(10)[as.numeric(cut(dat$y,breaks = 10))]

plot(dat$x,dat$y,pch = 20,col = dat$Col)
Related Posts:
- How to remove outliers from a dataset
- dplyr: “Error in n(): function should not be called directly”
- Error in eval(expr, envir, enclos) : object not found
- How do I convert a factor into date format?
- Write lines of text to a file in R
- scale_fill_discrete and scale_fill_manual – legend options confusion
- ‘Incomplete final line’ warning when trying to read a .csv file into R
- Conditional mean statement
- Warning in GLM analysis
- What does ‘length of ‘dimnames’ [1] not equal to array extent’ mean?
- How do I flip rows and columns in R
- How to catch integer(0)?
- “no function to return from, jumping to top level”
- r random forest error – type of predictors in new data do not match
- env=baseenv() in R
- Removing punctuations from text using R
- How to find out which package version is loaded in R?
- How to solve it. error:Error in data[[rowvar]] : attempt to select less than one element
- Gradient of n colors ranging from color 1 and color 2
- How to prevent scientific notation in R?
- What is the difference between require() and library()?
- How to declare a vector of zeros in R
- R Sweave: NO TeX installation detected
- ERROR: [on_request_read] connection reset by peer in R shiny
- Error in as.vector(x, mode) : cannot coerce type ‘closure’ to vector of type ‘any’
- Suppress output of a function
- Error in G * t(hat) : non-conformable arrays
- Error: isTRUE(gpclibPermitStatus()) is not TRUE
- How to counter the ‘non-numeric matrix extent’ error in R?
- What does is.na() applied to non-(list or vector) of type ‘NULL’ mean?
- error r: invalid subscript type “closure” in a simple regression
- Merge two rows in data.frame
- r function unzip error 1 in extracting from zip file
- Get the list of installed packages by user in R
- How to access the last value in a vector?
- increase legend font size ggplot2
- Mask output of `The following objects are masked from….:` after calling attach() function
- How To Create Vector of Vector In R
- Use of ~ (tilde) in R programming Language
- Construct a manual legend for a complicated plot
- Code to clear all plots in RStudio
- Error: x must be atomic for ‘sort.list’
- Installing R on Android
- Transposing in dplyr
- Does the c command create a row vector or a column vector by default in R
- Convert data.frame column to a vector?
- Error in summary.connection(connection) : invalid connection
- Converting from a character to a numeric data frame
- How to create lag variables
- When trying to replace values, “missing values are not allowed in subscripted assignments of data frames”
- R Hex to RGB converter
- Counting the number of elements with the values of x in a vector
- Non-numeric Argument to Binary Operator Error in R
- Error in ggplot.data.frame : Mapping should be created with aes or aes_string
- Error in file(file, “rt”) : invalid ‘description’ argument in complete.cases program
- SummarySE (Rmisc package) to produce a barplot with error bars (ggplot2)
- Editing legend (text) labels in ggplot
- Logistic Regression on factor: Error in eval(family$initialize) : y values must be 0 <= y <= 1
- R – longer object length is not a multiple of shorter object length
- Error: attempt to use zero-length variable name
- Plot multiple lines in one graph
- Replace a value in a data frame based on a conditional (`if`) statement
- How to read in .HTM into R as a data frame?
- Create empty data frame with column names by assigning a string vector?
- Changing font size and direction of axes text in ggplot2
- How to randomize ggplot factor color scheme, keeping same default distances on color wheel?
- Count number of occurences for each unique value
- Warning message: line appears to contain embedded nulls [duplicate]
- Find duplicate values in R
- How to change line width in ggplot?
- Error in library(ggplot2) : There is no package called ‘ggplot2’
- Transpose a data frame
- How to drop columns by name in a data frame
- How to reshape data from long to wide format
- Change size of axes title and labels in ggplot2
- Multiple If Statements in R
- ggplot geom_text font size control
- What’s the difference between lapply and do.call?
- ggplot2, change title size
- Combine two or more columns in a dataframe into a new column with a new name
- Initial value in ‘vmmin’ is not finite even when changing the starting value
- Insert picture/table in R Markdown
- Test if a vector contains a given element
- R “Error: unexpected ‘}’ in “}”
- Insert a blank column in dataframe
- “length of ‘dimnames’ [2] not equal to array extent” on one of two very similar sets
- Mean per group in a data.frame
- How to install RHadoop packages (Rmr, Rhdfs, Rhbase)?
- Error in dev.off() : cannot shut down device 1 (the null device)
- How to create an empty matrix in R?
- standard deviation on dataframe does not work
- Warning message: In `…` : invalid factor level, NA generated
- “non-numeric argument to binary operator” error in R
- How to increase font size in a plot in R?
- What is the difference between = and ==?
- Merge r brings error “‘by’ must specify uniquely valid columns”
- Replace all particular values in a data frame
- Subscripts in plots in R
- promise already under evaluation: recursive default argument reference or earlier problems?
- What does the error “arguments imply differing number of rows: x, y” mean?