if you give a 2D array to the plot function of matplotlib it will assume the columns to be lines:
If x and/or y is 2-dimensional, then the corresponding columns will be plotted.
In your case your shape is not accepted (100, 1, 1, 8000). As so you can using numpy squeeze to solve the problem quickly:
np.squeez doc: Remove single-dimensional entries from the shape of an array.
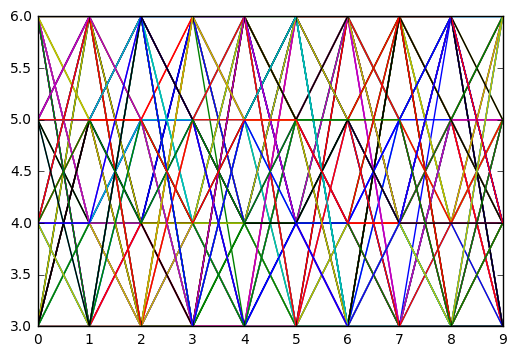
import numpy as np
import matplotlib.pyplot as plt

data = np.random.randint(3, 7, (10, 1, 1, 80))
newdata = np.squeeze(data) # Shape is now: (10, 80)
plt.plot(newdata) # plotting by columns
plt.show()
But notice that 100 sets of 80 000 points is a lot of data for matplotlib. I would recommend that you look for an alternative. The result of the code example (run in Jupyter) is:
Related Posts:
- TypeError: Invalid dimensions for image data when plotting array with imshow()
- ImportError: DLL load failed: The specified module could not be found
- ImportError: DLL load failed: The specified module could not be found
- ValueError: setting an array element with a sequence
- TypeError: only size-1 arrays can be converted to Python scalars (matplotlib)
- Numpy ValueError: setting an array element with a sequence. This message may appear without the existing of a sequence?
- numpy: Invalid value encountered in true_divide
- How do I create an empty array/matrix in NumPy?
- ValueError: operands could not be broadcast together with shapes (5,) (30,)
- numpy matrix vector multiplication
- Plotting a 2D heatmap with Matplotlib
- Convert pandas dataframe to NumPy array
- Unable to plot Double Bar, Bar plot using pyplot for ndarray
- size of NumPy array
- ValueError: all the input arrays must have same number of dimensions
- ValueError: setting an array element with a sequence
- Using Numpy Vectorize on Functions that Return Vectors
- Is there a NumPy function to return the first index of something in an array?
- Numpy/Python Array Value error
- initialize a numpy array
- TypeError: ‘DataFrame’ object is not callable
- load csv into 2D matrix with numpy for plotting
- How to access the ith column of a NumPy multidimensional array?
- Dump a NumPy array into a csv file
- Python: find position of element in array
- Overcome ValueError for empty array
- numpy with python: convert 3d array to 2d
- Python: slicing a multi-dimensional array
- How to remove specific elements in a numpy array
- Add single element to array in numpy
- How to normalize a 2-dimensional numpy array in python less verbose?
- Make list of arrays in python
- Understanding NumPy’s einsum
- ValueError: x and y must be the same size
- How to fix “TypeError: len() of unsized object”
- Numpy.dot TypeError: Cannot cast array data from dtype(‘float64’) to dtype(‘S32’) according to the rule ‘safe’
- Linear regression with matplotlib / numpy
- How to get the unit vector from a numpy array
- numpy-equivalent of list.pop?
- Using numpy to build an array of all combinations of two arrays
- Matplotlib: TypeError: can’t multiply sequence by non-int of type ‘numpy.float64’
- Efficiently sorting a numpy array in descending order?
- TypeError: only integer arrays with one element can be converted to an index 3
- How to create a numpy array of all True or all False?
- How to create a numpy array of lists?
- Removing nan values from an array
- IndexError: index 2 is out of bounds for axis 0 with size 2
- Root mean square of a function in python
- What are the differences between numpy arrays and matrices? Which one should I use?
- Numpy – add row to array
- Is there any numpy group by function?
- Mean Squared Error in Numpy?
- How to normalize a NumPy array to within a certain range?
- numpy array concatenation error: 0-d arrays can’t be concatenated
- Convert a 1D array to a 2D array in numpy
- inverting image in Python with OpenCV
- How to print the full NumPy array, without truncation?
- Sorting arrays in NumPy by column
- TypeError: zip argument #2 must support iteration
- numpy/scipy/ipython:Failed to interpret file as a pickle
- How to declare an array in Python?
- TypeError: only integer scalar arrays can be converted to a scalar index with 1D numpy indices array
- TypeError: list indices must be integers or slices, not str
- Import Error: No module named numpy
- Purpose of “%matplotlib inline”
- Purpose of “%matplotlib inline”
- numpy max vs amax vs maximum
- Showing an image with pylab.imshow()
- What exactly does numpy.exp() do? [closed]
- Difference between import numpy and import numpy as np
- How do you change the size of figures drawn with Matplotlib?
- What is the purpose of meshgrid in Python / NumPy?
- why numpy.ndarray is object is not callable in my simple for python loop
- numpy division with RuntimeWarning: invalid value encountered in double_scalars
- RuntimeWarning: invalid value encountered in divide
- Is “from matplotlib import pyplot as plt” == “import matplotlib.pyplot as plt”?
- python numpy ValueError: operands could not be broadcast together with shapes
- _tkinter.TclError: no display name and no $DISPLAY environment variable
- How to fix ‘Object arrays cannot be loaded when allow_pickle=False’ for imdb.load_data() function?
- Most efficient way to find mode in numpy array
- ValueError: Unknown label type: ‘continuous’
- _tkinter.TclError: no display name and no $DISPLAY environment variable
- ImportError: No module named matplotlib.pyplot
- TypeError: unhashable type: ‘numpy.ndarray’
- How to fix IndexError: invalid index to scalar variable
- matplotlib savefig() plots different from show()
- Could not install packages due to a “Environment error :[error 13]: permission denied : ‘usr/local/bin/f2py'”
- numpy division with RuntimeWarning: invalid value encountered in double_scalars
- How does numpy.newaxis work and when to use it?
- Converting list to numpy array
- How do I read CSV data into a record array in NumPy?
- data type not understood
- How do you do natural logs (e.g. “ln()”) with numpy in Python?
- How do I read CSV data into a record array in NumPy?
- How to normalize a NumPy array to a unit vector?
- Save plot to image file instead of displaying it using Matplotlib
- Should I use np.absolute or np.abs?
- What does numpy.random.seed(0) do?
- ImportError: numpy.core.multiarray failed to import
- Factorial in numpy and scipy