arange generates lists (well, numpy arrays); type help(np.arange) for the details. You don’t need to call it on existing lists.
>>> x = [1,2,3,4]
>>> y = [3,5,7,9]
>>>
>>> m,b = np.polyfit(x, y, 1)
>>> m
2.0000000000000009
>>> b
0.99999999999999833
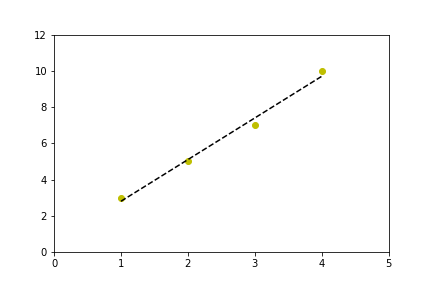
I should add that I tend to use poly1d here rather than write out “m*x+b” and the higher-order equivalents, so my version of your code would look something like this:
import numpy as np
import matplotlib.pyplot as plt

x = [1,2,3,4]
y = [3,5,7,10] # 10, not 9, so the fit isn't perfect

coef = np.polyfit(x,y,1)
poly1d_fn = np.poly1d(coef)
# poly1d_fn is now a function which takes in x and returns an estimate for y

plt.plot(x,y, 'yo', x, poly1d_fn(x), '--k') #'--k'=black dashed line, 'yo' = yellow circle marker

plt.xlim(0, 5)
plt.ylim(0, 12)
Related Posts:
- ImportError: DLL load failed: The specified module could not be found
- ImportError: DLL load failed: The specified module could not be found
- Plotting a 2D heatmap with Matplotlib
- Unable to plot Double Bar, Bar plot using pyplot for ndarray
- TypeError: ‘DataFrame’ object is not callable
- Overcome ValueError for empty array
- ValueError: x and y must be the same size
- TypeError: Invalid dimensions for image data when plotting array with imshow()
- Matplotlib: TypeError: can’t multiply sequence by non-int of type ‘numpy.float64’
- How to plot an array in python?
- IndexError: index 2 is out of bounds for axis 0 with size 2
- TypeError: zip argument #2 must support iteration
- numpy/scipy/ipython:Failed to interpret file as a pickle
- TypeError: only integer scalar arrays can be converted to a scalar index with 1D numpy indices array
- Import Error: No module named numpy
- Purpose of “%matplotlib inline”
- ValueError: setting an array element with a sequence
- Purpose of “%matplotlib inline”
- numpy max vs amax vs maximum
- TypeError: only size-1 arrays can be converted to Python scalars (matplotlib)
- Showing an image with pylab.imshow()
- What exactly does numpy.exp() do? [closed]
- Difference between import numpy and import numpy as np
- How do you change the size of figures drawn with Matplotlib?
- What is the purpose of meshgrid in Python / NumPy?
- why numpy.ndarray is object is not callable in my simple for python loop
- numpy division with RuntimeWarning: invalid value encountered in double_scalars
- RuntimeWarning: invalid value encountered in divide
- Numpy ValueError: setting an array element with a sequence. This message may appear without the existing of a sequence?
- numpy: Invalid value encountered in true_divide
- Is “from matplotlib import pyplot as plt” == “import matplotlib.pyplot as plt”?
- python numpy ValueError: operands could not be broadcast together with shapes
- _tkinter.TclError: no display name and no $DISPLAY environment variable
- How to fix ‘Object arrays cannot be loaded when allow_pickle=False’ for imdb.load_data() function?
- How do I create an empty array/matrix in NumPy?
- Most efficient way to find mode in numpy array
- ValueError: operands could not be broadcast together with shapes (5,) (30,)
- ValueError: Unknown label type: ‘continuous’
- _tkinter.TclError: no display name and no $DISPLAY environment variable
- ImportError: No module named matplotlib.pyplot
- TypeError: unhashable type: ‘numpy.ndarray’
- How to fix IndexError: invalid index to scalar variable
- matplotlib savefig() plots different from show()
- Could not install packages due to a “Environment error :[error 13]: permission denied : ‘usr/local/bin/f2py'”
- numpy division with RuntimeWarning: invalid value encountered in double_scalars
- How does numpy.newaxis work and when to use it?
- numpy matrix vector multiplication
- Converting list to numpy array
- How do I read CSV data into a record array in NumPy?
- data type not understood
- How do you do natural logs (e.g. “ln()”) with numpy in Python?
- How do I read CSV data into a record array in NumPy?
- How to normalize a NumPy array to a unit vector?
- Save plot to image file instead of displaying it using Matplotlib
- Should I use np.absolute or np.abs?
- What does numpy.random.seed(0) do?
- ImportError: numpy.core.multiarray failed to import
- Factorial in numpy and scipy
- No handles with labels found to put in legend
- How to plot a histogram using Matplotlib in Python with a list of data?
- What does the c underscore expression `c_` do exactly?
- Convert pandas dataframe to NumPy array
- In Matplotlib, what does the argument mean in fig.add_subplot(111)?
- ImportError: Missing required dependencies [‘numpy’]
- How can I plot a confusion matrix? [duplicate]
- Error: all the input array dimensions except for the concatenation axis must match exactly
- matplotlib error – no module named tkinter
- ImportError: numpy.core.multiarray failed to import
- How to count the occurrence of certain item in an ndarray?
- size of NumPy array
- Singular matrix issue with Numpy
- Python Pandas – Missing required dependencies [‘numpy’] 1
- numpy array concatenate: “ValueError: all the input arrays must have same number of dimensions”
- How to find all occurrences of an element in a list
- pandas DataFrame “no numeric data to plot” error
- TypeError: ‘numpy.float64’ object is not callable
- TypeError: ‘numpy.float64’ object is not callable
- ‘DataFrame’ object has no attribute ‘sort’
- Convert a tensor to numpy array in Tensorflow?
- ‘DataFrame’ object has no attribute ‘sort’
- Convert a tensor to numpy array in Tensorflow?
- ValueError: all the input arrays must have same number of dimensions
- How to change the font size on a matplotlib plot
- Permission denied error by installing matplotlib
- TypeError: cannot unpack non-iterable int objec
- Updating matplotlib in virtualenv with pip
- ValueError: setting an array element with a sequence
- filename.whl is not a supported wheel on this platform
- Using Numpy Vectorize on Functions that Return Vectors
- Use a.any() or a.all()
- TypeError: ‘numpy.float64’ object is not callable?
- ‘DataFrame’ object has no attribute ‘sort’
- How do you change the size of figures drawn with Matplotlib?
- Convert a tensor to numpy array in Tensorflow?
- How to normalize a NumPy array to a unit vector?
- How do I set the figure title and axes labels font size in Matplotlib?
- How to raise a numpy array to a power? (corresponding to repeated matrix multiplications, not elementwise)
- How to customize a scatter matrix to see all titles?
- Is there a list of line styles in matplotlib?
- Matplotlib automatic legend outside plot