Basically you have two options
scale_x_continuous(limits = c(-5000, 5000))
or
coord_cartesian(xlim = c(-5000, 5000))
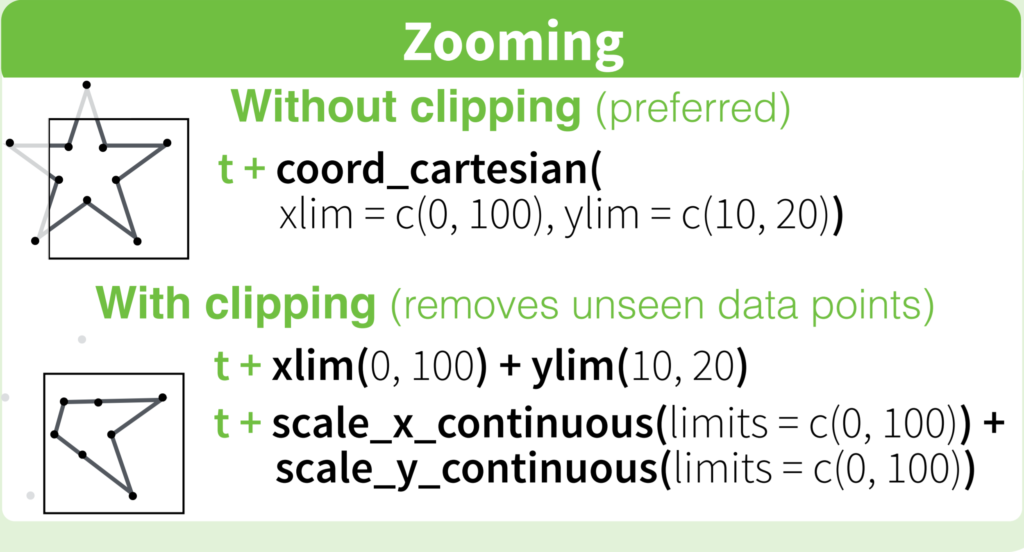
Where the first removes all data points outside the given range and the second only adjusts the visible area. In most cases you would not see the difference, but if you fit anything to the data it would probably change the fitted values.
You can also use the shorthand function xlim (or ylim), which like the first option removes data points outside of the given range:
+ xlim(-5000, 5000)
For more information check the description of coord_cartesian.
The RStudio cheatsheet for ggplot2 makes this quite clear visually. Here is a small section of that cheatsheet:
Distributed under CC BY.
Related Posts:
- R Hex to RGB converter
- How do I select the first row in an R data frame that meets certain criteria?
- Poker hand range chart visualization in R
- Poker hand range chart visualization in R
- Emulate ggplot2 default color palette
- ggplot wrong color assignment
- How to rename a single column in a data.frame?
- Critical t values in R
- Error in plot.new() : figure margins too large, Scatter plot
- Error in file(file, “rt”) : cannot open the connection [duplicate]
- Error in
: object of type ‘closure’ is not subsettable - What does %>% function mean in R?
- t-stat for feature selection
- Could not find function “%<>%” with dplyr loaded
- How to join (merge) data frames (inner, outer, left, right)
- Interpreting “condition has length > 1” warning from `if` function
- rbind error: “names do not match previous names”
- rbind error: “names do not match previous names”
- How to coerce a list object to type ‘double’
- Reasons for using the set.seed function
- R Error in x$ed : $ operator is invalid for atomic vectors
- $ operator is invalid for atomic vectors for dataframe R
- Plotting with ggplot2: “Error: Discrete value supplied to continuous scale” on categorical y-axis
- ggplot2 error : Discrete value supplied to continuous scale
- ggplot2 line chart gives “geom_path: Each group consist of only one observation. Do you need to adjust the group aesthetic?”
- ggplot2 line chart gives “geom_path: Each group consist of only one observation. Do you need to adjust the group aesthetic?”
- How to open CSV file in R when R says “no such file or directory”?
- Error: could not find function “%>%”
- R on MacOS Error: vector memory exhausted (limit reached?)
- R programming: How do I get Euler’s number?
- What does na.rm=TRUE actually means?
- Remove legend ggplot 2.2
- Error in if/while (condition) {: missing Value where TRUE/FALSE needed
- adding x and y axis labels in ggplot2
- How do I replace NA values with zeros in an R dataframe?
- How to change legend title in ggplot
- Changing column names of a data frame
- Set NA to 0 in R
- R: Using equation with natural logarithm in nls
- How to change legend title in ggplot
- Error in do_one(nmeth) : NA/NaN/Inf in foreign function call (arg 1)
- R on MacOS Error: vector memory exhausted (limit reached?)
- Counting the number of elements with the values of x in a vector
- Non-numeric Argument to Binary Operator Error in R
- kmeans complains “NA/NaN/Inf in foreign function call (arg 1)”, when there are none?
- Why use as.factor() instead of just factor()
- Update R using RStudio
- mean() warning: argument is not numeric or logical: returning NA
- ‘x’ and ‘y’ lengths differ ERROR when plotting
- What are the “standard unambiguous date” formats for string-to-date conversion in R?
- What does “Error: object ‘
‘ not found” mean? - Non-numeric Argument to Binary Operator Error in R
- mean() warning: argument is not numeric or logical: returning NA
- ‘x’ and ‘y’ lengths differ ERROR when plotting
- What are the “standard unambiguous date” formats for string-to-date conversion in R?
- R issue “object not found”
- Difference between paste() and paste0()
- Error in Confusion Matrix : the data and reference factors must have the same number of levels
- How do I delete rows in a data frame?
- Why do I get “number of items to replace is not a multiple of replacement length”
- Error in grid.Call(L_textBounds, as.graphicsAnnot(x$label), x$x, x$y, : Polygon edge not found
- Remove duplicated rows
- Drop data frame columns by name
- Having trouble setting working directory
- How to find the statistical mode?
- How can two strings be concatenated?
- Error in colMeans(x, na.rm = TRUE) : ‘x’ must be numeric in KNN classification
- Error in ggplot.data.frame : Mapping should be created with aes or aes_string
- Error in file(file, “rt”) : invalid ‘description’ argument in complete.cases program
- SummarySE (Rmisc package) to produce a barplot with error bars (ggplot2)
- Error in Confusion Matrix : the data and reference factors must have the same number of levels
- Remove a row from a data table in R
- Error in plot.window(…) : need finite ‘xlim’ values
- R ggplot2 scale_y_continuous : Combining breaks & limits
- Error in colMeans(x, na.rm = TRUE) : ‘x’ must be numeric, What should I do in this situation?
- Editing legend (text) labels in ggplot
- Add color to boxplot – “Continuous value supplied to discrete scale” error
- Extracting value specific rows in R
- case_when in mutate pipe
- “Error: Mapping should be created with `aes()` or `aes_()`.”
- Error in file(file, “rt”) : invalid ‘description’ argument in complete.cases program
- Error in plot.window(…) : need finite ‘xlim’ valuescc
- Principal Components Analysis:Error in colMeans(x, na.rm = TRUE) : ‘x’ must be numeric
- “Error: Continuous value supplied to discrete scale” in default data set example mtcars and ggplot2
- Logistic Regression on factor: Error in eval(family$initialize) : y values must be 0 <= y <= 1
- Longer object length is not a multiple of shorter object length?
- rmarkdown error “attempt to use zero-length variable name”
- Error: Incorrect number of dimensions in R
- plot.new has not been called yet
- Error in lm.fit(x,y,offset = offset, singular.ok,…) 0 non-NA cases with boxcox formula
- cannot coerce type ‘closure’ to vector of type ‘character’
- dim(X) must have a positive length when applying function in data frame
- Error in lm.fit(x, y, offset = offset, singular.ok = singular.ok, …) : NA/NaN/Inf in ‘y’, tried every possible way
- Extract year from date
- Basic – T-Test -> Grouping Factor Must have Exactly 2 Levels
- Persistent invalid graphics state error when using ggplot2
- Logistic regression – eval(family$initialize) : y values must be 0 <= y <= 1
- R – longer object length is not a multiple of shorter object length
- Error: attempt to use zero-length variable name
- incorrect number of dimensions and incorrect number of subscripts in array