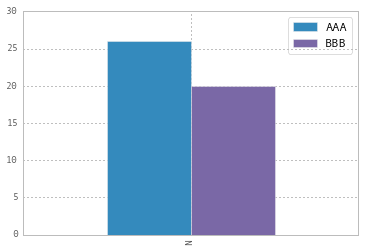
To change the labels for Pandas df.plot() use ax.legend([...]):
import pandas as pd
import matplotlib.pyplot as plt

fig, ax = plt.subplots()
df = pd.DataFrame({'A':26, 'B':20}, index=['N'])
df.plot(kind='bar', ax=ax)
#ax = df.plot(kind='bar') # "same" as above
ax.legend(["AAA", "BBB"]);
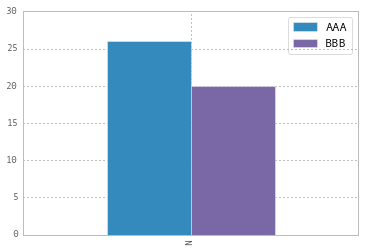
Another approach is to do the same by plt.legend([...]):
import matplotlib.pyplot as plt
df.plot(kind='bar')
plt.legend(["AAA", "BBB"]);
Related Posts:
- How do you change the size of figures drawn with Matplotlib?
- matplotlib savefig() plots different from show()
- Save plot to image file instead of displaying it using Matplotlib
- pandas DataFrame “no numeric data to plot” error
- How do you change the size of figures drawn with Matplotlib?
- How to customize a scatter matrix to see all titles?
- Matplotlib automatic legend outside plot
- Matplotlib automatic legend outside plot
- Changing the “tick frequency” on x or y axis in matplotlib?
- Plot pie chart and table of pandas dataframe
- TypeError: ‘DataFrame’ object is not callable
- How to add title to subplots in Matplotlib
- Create own colormap using matplotlib and plot color scale
- How to make a 3D scatter plot in matplotlib
- Changing the “tick frequency” on x or y axis in matplotlib
- Remove xticks in a matplotlib plot?
- How to add title to seaborn boxplot
- How to save a Seaborn plot into a file
- Plot correlation matrix using pandas
- Scatter plot colorbar – Matplotlib
- Plotting multiple lines, in different colors, with pandas dataframe
- Why do many examples use `fig, ax = plt.subplots()` in Matplotlib/pyplot/python
- matplotlib: plot multiple columns of pandas data frame on the bar chart
- Pandas dataframe groupby plot
- How do I tell Matplotlib to create a second (new) plot, then later plot on the old one?
- alueError: ordinal must be >= 1
- how to sort pandas dataframe from one column
- ImportError: DLL load failed: The specified module could not be found
- ImportError: DLL load failed: The specified module could not be found
- Renaming column names in Pandas
- How to reset index in a pandas dataframe? [duplicate]
- Delete a column from a Pandas DataFrame
- How to deal with SettingWithCopyWarning in Pandas
- How to deal with SettingWithCopyWarning in Pandas
- Constructing pandas DataFrame from values in variables gives “ValueError: If using all scalar values, you must pass an index”
- How to iterate over rows in a DataFrame in Pandas
- pandas read_json: “If using all scalar values, you must pass an index”
- How to iterate over rows in a DataFrame in Pandas
- What is the difference between importing matplotlib and matplotlib.pyplot?
- Purpose of “%matplotlib inline”
- Writing a pandas DataFrame to CSV file
- Purpose of “%matplotlib inline”
- Truth value of a Series is ambiguous. Use a.empty, a.bool(), a.item(), a.any() or a.all()
- TypeError: only size-1 arrays can be converted to Python scalars (matplotlib)
- Truth value of a Series is ambiguous. Use a.empty, a.bool(), a.item(), a.any() or a.all()
- Showing an image with pylab.imshow()
- Writing a pandas DataFrame to CSV file
- Adding new column to existing DataFrame in Python pandas
- Modifing data while using iterrows() does not work
- ImportError: No module named pandas
- How to change the order of DataFrame columns?
- RuntimeWarning: invalid value encountered in divide
- How to change the order of DataFrame columns?
- ImportError: No module named pandas. Pandas installed pip
- Is “from matplotlib import pyplot as plt” == “import matplotlib.pyplot as plt”?
- What does `ValueError: cannot reindex from a duplicate axis` mean?
- Pandas DataFrame Groupby two columns and get counts
- _tkinter.TclError: no display name and no $DISPLAY environment variable
- How can I use the apply() function for a single column?
- How to show all columns’ names on a large pandas dataframe?
- ValueError: operands could not be broadcast together with shapes (5,) (30,)
- Convenient way to deal with ValueError: cannot reindex from a duplicate axis
- ValueError: Unknown label type: ‘continuous’
- How to groupby based on two columns in pandas?
- _tkinter.TclError: no display name and no $DISPLAY environment variable
- ImportError: No module named matplotlib.pyplot
- How to fix IndexError: invalid index to scalar variable
- “Series objects are mutable and cannot be hashed” error
- How to deal with SettingWithCopyWarning in Pandas
- Merging dataframes on index with pandas
- ImportError: No module named pandas
- TypeError: ‘Series’ objects are mutable, thus they cannot be hashed problemwith column
- Create a Pandas Dataframe by appending one row at a time
- How to replace NaN values by Zeroes in a column of a Pandas Dataframe?
- ValueError: Length of values does not match length of index | Pandas DataFrame.unique()
- Plotting a 2D heatmap with Matplotlib
- Convert Python dict into a dataframe
- re.sub erroring with “Expected string or bytes-like object”
- Creating an empty Pandas DataFrame, then filling it?
- How do I select rows from a DataFrame based on column values?
- How do I select rows from a DataFrame based on column values?
- How to plot ROC curve in Python
- DataFrame constructor not properly called! error
- Pandas group-by and sum
- How do I get the row count of a Pandas DataFrame?
- Python pandas groupby aggregate on multiple columns, then pivot
- Python Pandas Counting the Occurrences of a Specific value
- No handles with labels found to put in legend
- How to plot a histogram using Matplotlib in Python with a list of data?
- Convert pandas dataframe to NumPy array
- Count unique values per groups with Pandas
- DataFrame constructor not properly called
- In Matplotlib, what does the argument mean in fig.add_subplot(111)?
- Convert pandas Series to DataFrame
- Error:cannot convert float NaN to integer in pandas
- ImportError: Missing required dependencies [‘numpy’]
- How can I plot a confusion matrix? [duplicate]
- Replacing column values in a pandas DataFrame
- Unable to plot Double Bar, Bar plot using pyplot for ndarray
- Error”Can only compare identically-labeled Series objects” and sort_index