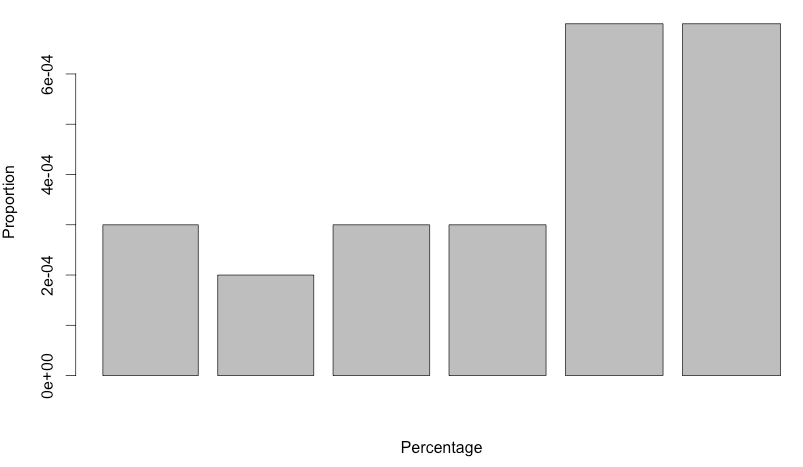
You can specify the two variables you want to plot rather than passing the whole data frame, like so:
data <- structure(list(V1 = c(34.88372093, 35.07751938, 35.27131783, 35.46511628, 35.65891473, 35.85271318),
                       V2 = c(0.00029997, 0.00019998, 0.00029997, 0.00029997, 0.00069993, 0.00069993)),
                  .Names = c("V1", "V2"), row.names = c(NA, 6L), class = "data.frame")

barplot(data$V2, data$V1, xlab="Percentage", ylab="Proportion")

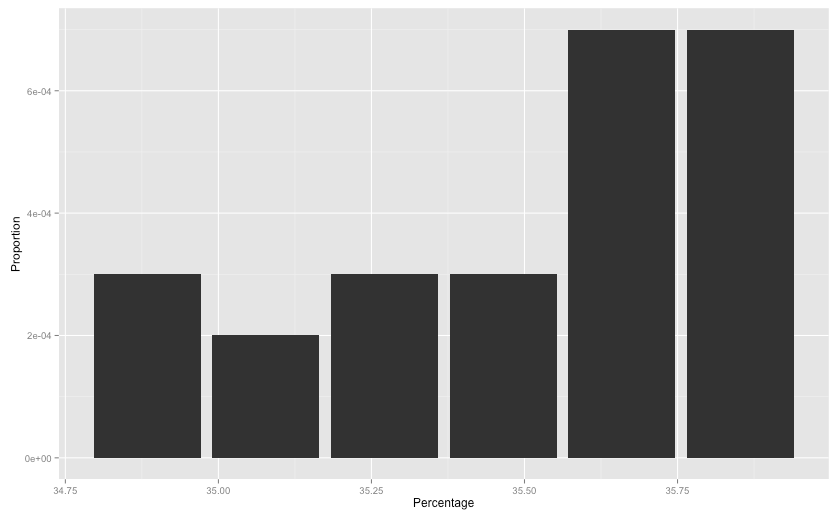
Alternatively, you can use ggplot to do this:
library(ggplot2)
ggplot(data, aes(x=V1, y=V2)) + geom_bar(stat="identity") +
  labs(x="Percentage", y="Proportion")

Related Posts:
- How do I select the first row in an R data frame that meets certain criteria?
- Poker hand range chart visualization in R
- Poker hand range chart visualization in R
- Error in plot.new() : figure margins too large, Scatter plot
- What does %>% function mean in R?
- How to join (merge) data frames (inner, outer, left, right)
- rbind error: “names do not match previous names”
- R on MacOS Error: vector memory exhausted (limit reached?)
- adding x and y axis labels in ggplot2
- Set NA to 0 in R
- R: Using equation with natural logarithm in nls
- How to change legend title in ggplot
- kmeans complains “NA/NaN/Inf in foreign function call (arg 1)”, when there are none?
- Why use as.factor() instead of just factor()
- Update R using RStudio
- mean() warning: argument is not numeric or logical: returning NA
- What does “Error: object ‘
‘ not found” mean? - mean() warning: argument is not numeric or logical: returning NA
- How do I delete rows in a data frame?
- Error in grid.Call(L_textBounds, as.graphicsAnnot(x$label), x$x, x$y, : Polygon edge not found
- Drop data frame columns by name
- Having trouble setting working directory
- How to find the statistical mode?
- How can two strings be concatenated?
- Error in colMeans(x, na.rm = TRUE) : ‘x’ must be numeric in KNN classification
- SummarySE (Rmisc package) to produce a barplot with error bars (ggplot2)
- Remove a row from a data table in R
- R ggplot2 scale_y_continuous : Combining breaks & limits
- Add color to boxplot – “Continuous value supplied to discrete scale” error
- Error in plot.window(…) : need finite ‘xlim’ valuescc
- “Error: Continuous value supplied to discrete scale” in default data set example mtcars and ggplot2
- Logistic Regression on factor: Error in eval(family$initialize) : y values must be 0 <= y <= 1
- rmarkdown error “attempt to use zero-length variable name”
- Error: Incorrect number of dimensions in R
- cannot coerce type ‘closure’ to vector of type ‘character’
- Basic – T-Test -> Grouping Factor Must have Exactly 2 Levels
- R – longer object length is not a multiple of shorter object length
- Error: attempt to use zero-length variable name
- How does one reorder columns in a data frame?
- R error: cannot coerce type ‘closure’ to vector of type ‘double’
- R: Using equation with natural logarithm in nls
- remove legend title in ggplot
- scale_color_manual() not working
- Error in lm.fit(x, y, offset = offset, singular.ok = singular.ok, …) 0 non-na cases
- Clear R environment of all objetcs & packages
- Why I get this error writing data to a file
- How to save a data frame as CSV to a user selected location using tcltk
- Manually colouring plots with `scale_fill_manual` in ggplot2 not working
- Subscript out of bounds – general definition and solution?
- R: Error in eval(predvars, data, env) : numeric ‘envir’ arg not of length one in intrinsic.pars() in multgee package
- Convert a list to a data frame
- Remove grid, background color, and top and right borders from ggplot2
- What does the double percentage sign (%%) mean?
- How to subset a Data frame column wise using column names?
- Create an empty data.frame
- Error : length of ‘dimnames’ [2] not equal to array extent
- Can’t draw Histogram, ‘x’ must be numeric
- How can I plot data with confidence intervals?
- MLE error in R: initial value in ‘vmmin’ is not finite
- Unimplemented type list when trying to write.table
- Custom legend for multiple layer ggplot
- Subscript out of bounds – general definition and solution?
- Reshaping data.frame from wide to long format
- How to set limits for axes in ggplot2 R plots?
- duplicate ‘row.names’ are not allowed error
- predict.lm() in a loop. warning: prediction from a rank-deficient fit may be misleading
- Convert categorical variables to numeric in R
- How to sum data.frame column values?
- Mean of a column in a data frame, given the column’s name
- readOGR() cannot open file
- What does “The following object is masked from ‘package:xxx'” mean?
- grep using a character vector with multiple patterns
- How to avoid “Error in stripchart.default(x1, …) : invalid plotting method” error?
- R error in unique.default(x) unique() applies only to vectors
- install.packages fails in knitr document: “trying to use CRAN without setting a mirror”
- Unused arguments in R
- How to convert a data frame column to numeric type?
- Optimization of a function in R ( L-BFGS-B needs finite values of ‘fn’)
- Error: ggplot2 doesn’t know how to deal with data of class matrix?
- Error in file(filename, “r”, encoding = encoding) : cannot open the connection
- What is integer overflow in R and how can it happen?
- Error in contrib.url(repos, “source”) in R trying to use CRAN without setting a mirror Calls: install.packages -> contrib.url Execution halted
- Error in eval(predvars, data, env) : invalid ‘envir’ argument of type ‘character’
- Error in
: target of assignment expands to non-language object - run a for loop in parallel in R
- How do I combine two data-frames based on two columns?
- Efficiently sum across multiple columns in R
- How to eliminate “NA/NaN/Inf in foreign function call (arg 7)” running predict with randomForest
- Indicator function in R
- IF “OR” multiple conditions
- R4DS error comparison (1) is possible only for atomic and list types
- Error in x[[i]] : recursive indexing failed at level 2
- non-numeric argument to binary operator
- How to avoid “operations are possible only for numeric, logical or complex types” when computing top 3 elements in each group
- Column standard deviation R [duplicate]
- Difference between as.POSIXct/as.POSIXlt and strptime for converting character vectors to POSIXct/POSIXlt
- invalid (do_set) left-hand side to assignment in R
- How do I print a hexadecimal number with leading 0 to have width 2 using sprintf?
- In R, dealing with Error: ggplot2 doesn’t know how to deal with data of class numeric
- How to deal with “data of class uneval” error from ggplot2?
