You just have the wrong order of your commands. A backend should be set before importing pyplot in jupyter. Or in other words, after changing the backend, pyplot needs to be imported again.
Therefore call %matplotlib ... prior to importing pyplot.
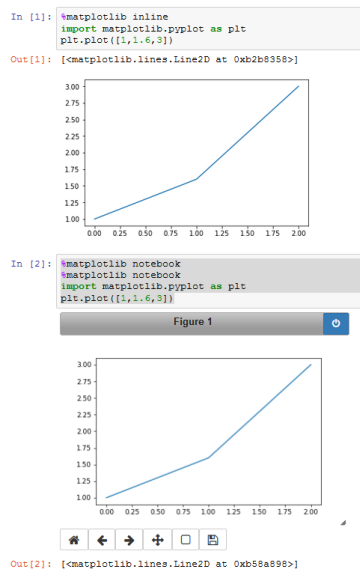
In first cell:
%matplotlib inline
import matplotlib.pyplot as plt
plt.plot([1,1.6,3])
In second cell:
%matplotlib notebook
#calling it a second time may prevent some graphics errors
%matplotlib notebook
import matplotlib.pyplot as plt
plt.plot([1,1.6,3])
Related Posts:
- Purpose of “%matplotlib inline”
- Purpose of “%matplotlib inline”
- When I use matplotlib in jupyter notebook,it always raise ” matplotlib is currently using a non-GUI backend” error?
- IPython, “name ‘plt’ not defined”
- ImportError: DLL load failed: The specified module could not be found
- ImportError: DLL load failed: The specified module could not be found
- TypeError: only size-1 arrays can be converted to Python scalars (matplotlib)
- Showing an image with pylab.imshow()
- How do you change the size of figures drawn with Matplotlib?
- RuntimeWarning: invalid value encountered in divide
- Is “from matplotlib import pyplot as plt” == “import matplotlib.pyplot as plt”?
- _tkinter.TclError: no display name and no $DISPLAY environment variable
- ValueError: operands could not be broadcast together with shapes (5,) (30,)
- _tkinter.TclError: no display name and no $DISPLAY environment variable
- ImportError: No module named matplotlib.pyplot
- Jupyter Notebook not saving: ‘_xsrf’ argument missing from post
- matplotlib savefig() plots different from show()
- Jupyter Notebook not saving: ‘_xsrf’ argument missing from post
- Plotting a 2D heatmap with Matplotlib
- Save plot to image file instead of displaying it using Matplotlib
- No handles with labels found to put in legend
- How to plot a histogram using Matplotlib in Python with a list of data?
- In Matplotlib, what does the argument mean in fig.add_subplot(111)?
- How can I plot a confusion matrix? [duplicate]
- Unable to plot Double Bar, Bar plot using pyplot for ndarray
- matplotlib error – no module named tkinter
- pandas DataFrame “no numeric data to plot” error
- How to change the font size on a matplotlib plot
- Permission denied error by installing matplotlib
- How to do superscripts and subscripts in Jupyter Notebook?
- How to do superscripts and subscripts in Jupyter Notebook?
- Updating matplotlib in virtualenv with pip
- Error while Executing jupyter notebook: [Errno 2] No such file or directory
- How do you change the size of figures drawn with Matplotlib?
- How do I set the figure title and axes labels font size in Matplotlib?
- How to customize a scatter matrix to see all titles?
- Is there a list of line styles in matplotlib?
- Matplotlib automatic legend outside plot
- Add Legend to Seaborn point plot
- What is the difference between Jupyter Notebook and JupyterLab?
- Matplotlib automatic legend outside plot
- Changing the “tick frequency” on x or y axis in matplotlib?
- matplotlib error – no module named tkinter
- Plotting multiple different plots in one figure using Seaborn
- Plot pie chart and table of pandas dataframe
- ModuleNotFoundError: No module named ‘matplotlib’
- Change figure size and figure format in matplotlib
- Add Legend to Seaborn point plot
- TypeError: ‘DataFrame’ object is not callable
- Improve subplot size/spacing with many subplots in matplotlib
- convert json ipython notebook(.ipynb) to .py file
- How do I plot only a table in Matplotlib?
- Python equivalent to ‘hold on’ in Matlab
- How to add title to subplots in Matplotlib
- How to get autocomplete in jupyter notebook without using tab?
- Overcome ValueError for empty array
- Running Jupyter via command line on Windows
- How to change a ‘LinearSegmentedColormap’ to a different distribution of color?
- Display image as grayscale using matplotlib
- Create own colormap using matplotlib and plot color scale
- Why matplotlib does not plot?
- How to convert IPython notebooks to PDF and HTML?
- ‘Jupyter’ is not recognized as an internal or external command
- reducing number of plot ticks
- How to increase plt.title font size?
- How to make a 3D scatter plot in matplotlib
- How to draw vertical lines on a given plot in matplotlib
- Modify the legend of pandas bar plot
- Plot a horizontal line using matplotlib
- Changing the “tick frequency” on x or y axis in matplotlib
- How can I set the aspect ratio in matplotlib?
- Remove xticks in a matplotlib plot?
- How to add title to seaborn boxplot
- python SyntaxError: invalid syntax %matplotlib inline
- How to update a plot in matplotlib?
- How to make a histogram from a list of data
- How do I change the figure size with subplots?
- ValueError: x and y must be the same size
- ValueError: Unknown projection ‘3d’ (once again)
- How to change plot background color?
- raise LinAlgError(“SVD did not converge”) LinAlgError: SVD did not converge in matplotlib pca determination
- TypeError: Invalid dimensions for image data when plotting array with imshow()
- matplotlib does not show my drawings although I call pyplot.show()
- Linear regression with matplotlib / numpy
- How to save a Seaborn plot into a file
- Plot correlation matrix using pandas
- Scatter plot colorbar – Matplotlib
- matplotlib: how to draw a rectangle on image
- bbox_to_anchor and loc in matplotlib
- Python, Matplotlib, subplot: How to set the axis range?
- How to put the legend out of the plot
- Matplotlib: TypeError: can’t multiply sequence by non-int of type ‘numpy.float64’
- RuntimeError: Invalid DISPLAY variable
- How to plot an array in python?
- ImportError: No module named xgboost
- Seaborn Lineplot Module Object Has No Attribute ‘Lineplot’
- kernel keeps dying in jupyter notebook
- IndexError: index 2 is out of bounds for axis 0 with size 2
- Matplotlib plots: removing axis, legends and white spaces
- Why do many examples use `fig, ax = plt.subplots()` in Matplotlib/pyplot/python