you can use plt.matshow() instead of plt.imshow() or you can use seaborn module’s heatmap (see documentation) to plot the confusion matrix
import seaborn as sn
import pandas as pd
import matplotlib.pyplot as plt
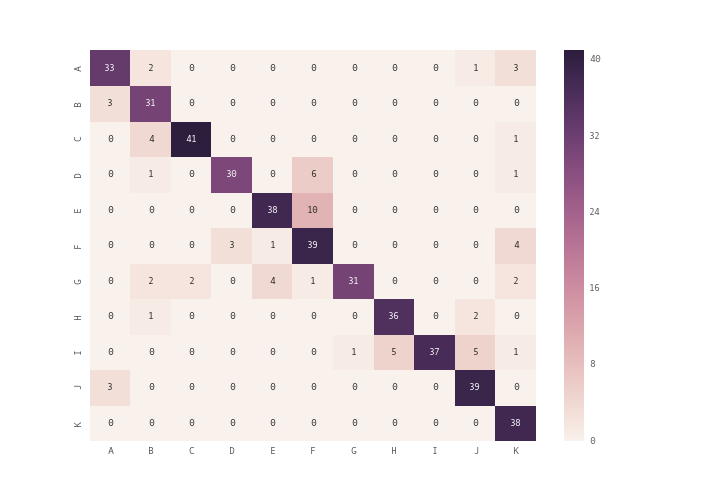
array = [[33,2,0,0,0,0,0,0,0,1,3],
[3,31,0,0,0,0,0,0,0,0,0],
[0,4,41,0,0,0,0,0,0,0,1],
[0,1,0,30,0,6,0,0,0,0,1],
[0,0,0,0,38,10,0,0,0,0,0],
[0,0,0,3,1,39,0,0,0,0,4],
[0,2,2,0,4,1,31,0,0,0,2],
[0,1,0,0,0,0,0,36,0,2,0],
[0,0,0,0,0,0,1,5,37,5,1],
[3,0,0,0,0,0,0,0,0,39,0],
[0,0,0,0,0,0,0,0,0,0,38]]
df_cm = pd.DataFrame(array, index = [i for i in "ABCDEFGHIJK"],
columns = [i for i in "ABCDEFGHIJK"])
plt.figure(figsize = (10,7))
sn.heatmap(df_cm, annot=True)
Related Posts:
- How to define a two-dimensional array?
- ImportError: DLL load failed: The specified module could not be found
- ImportError: DLL load failed: The specified module could not be found
- Purpose of “%matplotlib inline”
- Purpose of “%matplotlib inline”
- TypeError: only size-1 arrays can be converted to Python scalars (matplotlib)
- Showing an image with pylab.imshow()
- How do you change the size of figures drawn with Matplotlib?
- No module named ‘sklearn.cross_validation’
- RuntimeWarning: invalid value encountered in divide
- Is “from matplotlib import pyplot as plt” == “import matplotlib.pyplot as plt”?
- _tkinter.TclError: no display name and no $DISPLAY environment variable
- ValueError: operands could not be broadcast together with shapes (5,) (30,)
- ValueError: Unknown label type: ‘continuous’
- _tkinter.TclError: no display name and no $DISPLAY environment variable
- ImportError: No module named matplotlib.pyplot
- Transpose/Unzip Function (inverse of zip)?
- matplotlib savefig() plots different from show()
- numpy matrix vector multiplication
- Converting list to numpy array
- sklearn error ValueError: Input contains NaN, infinity or a value too large for dtype(‘float64’)
- sklearn error ValueError: Input contains NaN, infinity or a value too large for dtype(‘float64’)
- TypeError: cannot perform reduce with flexible type
- data type not understood
- sklearn error ValueError: Input contains NaN, infinity or a value too large for dtype(‘float64’)
- Plotting a 2D heatmap with Matplotlib
- How to normalize a NumPy array to a unit vector?
- Save plot to image file instead of displaying it using Matplotlib
- ModuleNotFoundError: No module named ‘sklearn’
- No handles with labels found to put in legend
- How to plot a histogram using Matplotlib in Python with a list of data?
- In Matplotlib, what does the argument mean in fig.add_subplot(111)?
- Arrays used as indices must be of integer (or boolean) type
- Unable to plot Double Bar, Bar plot using pyplot for ndarray
- ModuleNotFoundError: No module named ‘sklearn’
- matplotlib error – no module named tkinter
- Singular matrix issue with Numpy
- pandas DataFrame “no numeric data to plot” error
- How to change the font size on a matplotlib plot
- Permission denied error by installing matplotlib
- Updating matplotlib in virtualenv with pip
- How do you change the size of figures drawn with Matplotlib?
- How to normalize a NumPy array to a unit vector?
- How do I set the figure title and axes labels font size in Matplotlib?
- How to customize a scatter matrix to see all titles?
- Is there a list of line styles in matplotlib?
- Matplotlib automatic legend outside plot
- Add Legend to Seaborn point plot
- How to get element-wise matrix multiplication (Hadamard product) in numpy?
- Matplotlib automatic legend outside plot
- Changing the “tick frequency” on x or y axis in matplotlib?
- matplotlib error – no module named tkinter
- Plotting multiple different plots in one figure using Seaborn
- Plot pie chart and table of pandas dataframe
- ModuleNotFoundError: No module named ‘matplotlib’
- Change figure size and figure format in matplotlib
- Add Legend to Seaborn point plot
- TypeError: ‘DataFrame’ object is not callable
- Improve subplot size/spacing with many subplots in matplotlib
- How do I plot only a table in Matplotlib?
- Python equivalent to ‘hold on’ in Matlab
- Inverse of a matrix using numpy
- How to add title to subplots in Matplotlib
- Overcome ValueError for empty array
- Using %matplotlib notebook after %matplotlib inline in Jupyter Notebook doesn’t work
- How to change a ‘LinearSegmentedColormap’ to a different distribution of color?
- Display image as grayscale using matplotlib
- Create own colormap using matplotlib and plot color scale
- Why matplotlib does not plot?
- reducing number of plot ticks
- How to increase plt.title font size?
- How to make a 3D scatter plot in matplotlib
- Arrays used as indices must be of integer (or boolean) type
- How to draw vertical lines on a given plot in matplotlib
- Modify the legend of pandas bar plot
- Plot a horizontal line using matplotlib
- Changing the “tick frequency” on x or y axis in matplotlib
- How can I set the aspect ratio in matplotlib?
- Remove xticks in a matplotlib plot?
- How to add title to seaborn boxplot
- python SyntaxError: invalid syntax %matplotlib inline
- sklearn Logistic Regression “ValueError: Found array with dim 3. Estimator expected <= 2."
- How to update a plot in matplotlib?
- RuntimeWarning: numpy.dtype size changed, may indicate binary incompatibility
- How to make a histogram from a list of data
- Difference between scikit-learn and sklearn
- How do I change the figure size with subplots?
- ValueError: x and y must be the same size
- ValueError: Unknown projection ‘3d’ (once again)
- How to change plot background color?
- raise LinAlgError(“SVD did not converge”) LinAlgError: SVD did not converge in matplotlib pca determination
- TypeError: Invalid dimensions for image data when plotting array with imshow()
- matplotlib does not show my drawings although I call pyplot.show()
- Linear regression with matplotlib / numpy
- Get Confusion Matrix From a Keras Multiclass Model
- What’s the difference between scikit-learn and tensorflow? Is it possible to use them together?
- How to save a Seaborn plot into a file
- Plot correlation matrix using pandas
- Scatter plot colorbar – Matplotlib
- matplotlib: how to draw a rectangle on image