do you have any idea how to make 200 evenly spaced out bins, and have your program store the data in the appropriate bins?
You can, for example, use NumPy’s arange for a fixed bin size (or Python’s standard range object), and NumPy’s linspace for evenly spaced bins. Here are 2 simple examples from my matplotlib gallery
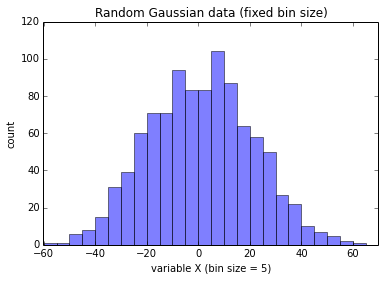
Fixed bin size
import numpy as np
import random
from matplotlib import pyplot as plt

data = np.random.normal(0, 20, 1000)

# fixed bin size
bins = np.arange(-100, 100, 5) # fixed bin size

plt.xlim([min(data)-5, max(data)+5])

plt.hist(data, bins=bins, alpha=0.5)
plt.title('Random Gaussian data (fixed bin size)')
plt.xlabel('variable X (bin size = 5)')
plt.ylabel('count')

plt.show()
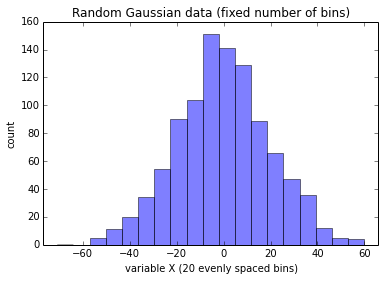
Fixed number of bins
import numpy as np
import math
from matplotlib import pyplot as plt

data = np.random.normal(0, 20, 1000)

bins = np.linspace(math.ceil(min(data)),
                   math.floor(max(data)),
                   20) # fixed number of bins

plt.xlim([min(data)-5, max(data)+5])

plt.hist(data, bins=bins, alpha=0.5)
plt.title('Random Gaussian data (fixed number of bins)')
plt.xlabel('variable X (20 evenly spaced bins)')
plt.ylabel('count')

plt.show()